Mito-Plot Chart : Insights for Medical Professionals
by Swapnil Shrivastava
Published: 2020
Mito-Plot Chart : Insights for Medical Professionals
BDB integrated Mito-Plot Chart into its charting library. It's a very advanced chart which is based on mitochondrial DNA study. This chart can be used by the medical expert to provide data visualization of person-specific mitochondrial DNA damage through the BDB data visualization (Data label & Tool-tip).
Mitochondrial DNA (mtDNA or mDNA) is located inside mitochondria; it releases the energy of food and stores in ATP (Adenosine triphosphate) molecule. The human body contains 16,569 base pairs of mitochondrial DNA that used to encode for 37 genes only. mtDNA is inherited maternal DNA it means inherited solely from the mother. That’s why it shows heteroplasmy, and this is an important factor in considering the intensity of mitochondrial diseases. That’s why mtDNA study and monitoring provide a new perspective to diagnose the common complex diseases. The maternally inherited mtDNA has a very high mutation rate that’s why new mtDNA mutations arise among thousands of other mtDNAs. The mechanisms on which these “heteroplasmic” mtDNA mutations work is to predominate in the female germline, and somatic tissues are poorly understood, but essential for understanding the clinical variability of a range of diseases. Although this is very helpful for the prevention and diagnose mtDNA disease.
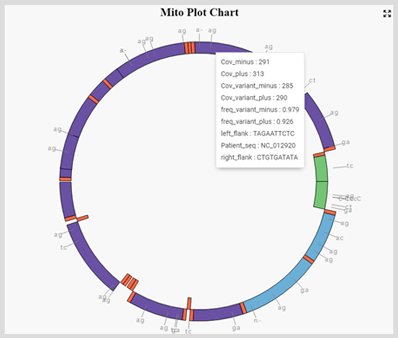
BDB Mito-Plot chart shows the basic structure of mtDNA as shown in the figure. Mito-Plot chart divided into different segments each segment produces a protein (RNA type) these proteins is important during the cellular respiration cycle. These segments have been defined through the category, and its color depends on the RNA type what it contains. mtDNA has two strands, and that can be differentiated on the basis of their nucleotide content, these two strands are a heavy strand or H-strand and light strand or L-strand. H-strand is genuine rich strand and represents through the segment which orientation towards outside. L-strand is a cytosine-rich strand that represents through the segment which orients towards inside.
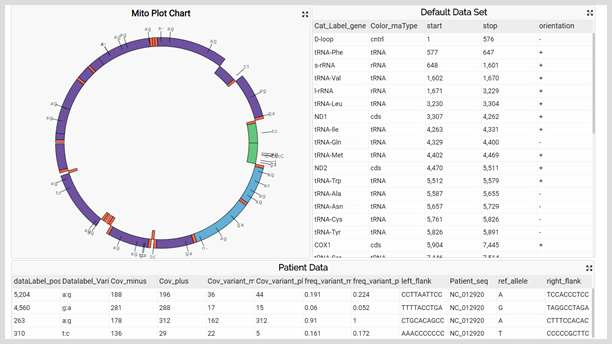
Data Label shows the different variants of mtDNA of that particular person to whom it gets associated. Variants are helpful to locate the mitochondrial damages. These damages cause mitochondrial diseases. Examples of mitochondrial diseases include Mitochondrial Myopathy, Diabetes Mellitus and Deafness (DAD) Leber's Hereditary Optic Neuropathy (LHON) Leigh Syndrome, Subacute Sclerosing Encephalopathy, Neuropathy, Ataxia, Retinitis Pigmentosa, and Ptosis (NARP) Myoneurogenic Gastrointestinal Encephalopathy (MNGIE).
Tooltip shows the different aspects of that particular variants and with the help of BDB custom tool any of the information can display on top of it even in the form of video or image.
Thus, BDB's Mito-plot chart is very useful for medical experts to analyze Mitochondrial diseases. Mitochondrial diseases are basically a group of disorders, and that is caused by defects in components of the respiratory chain and are associated with mutations in mitochondrial DNA (mtDNA).