Leaflet Chart in BDB Dashboard
With the steep rise of data volume, the need for data analytics has shot up. Businesses rely on analytical presentation
to turn the mountainous amount of data into actionable insights. The Analytics Platform needs a sharp component library to generate significant
data insights. A powerful and penetrating Visualization layer lets you explore the transformed business data visually to identify patterns &
relationships through the rich charting library.
BDB Dashboard Designer can anticipate complex business data in the most simplified way. BDB has 60+ charting components
in different theme formats. These charts are highly customizable, where the user can change the properties, the create various scenario to
visualize the data and save those scenarios for other users. The user can build captivating dashboards using our advanced charting component
and integrated custom components to see through their business data.
Leaflet
The leaflet is a leading open-source interactive map component that points the area (country, state, city) based on the
latitude and longitude. This mobile-friendly map component allows users to avail all the mapping features required for geospatial mapping.
Leaflet maps are popular because of its simplicity and high performance. Users can achieve relevant insights into Geospatial data through the
Leaflet Map by analyzing the Region, State, City, and even streetwise position coordinates.
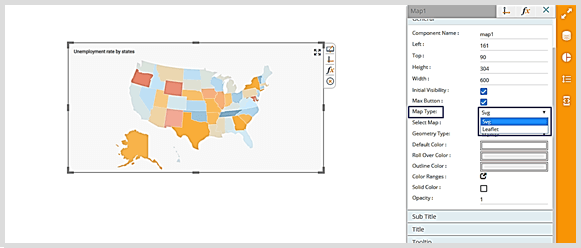
In the existing SVG Map component, we have added an option to change it as a Leaflet Map, which supports static range
and dynamic range colors along with transparency.
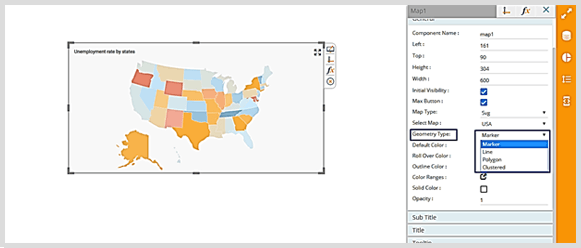
In Leaflet Maps, four types of maps are available:
- Marker
- Line
- Polygon
- Clustered
- -> Marker and Clustered type maps consider latitude and longitude points as mandatory fields in the data.
- -> Line and Polygon type maps require shapefile to draw using the Platform Administration module to configure and upload them with GeoJSON information.
- -> All these map types require latitude and longitude points as data to plot on the map.
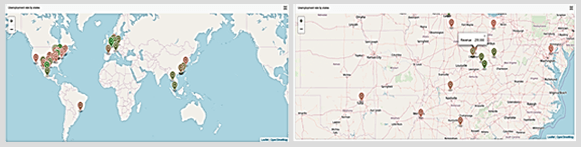
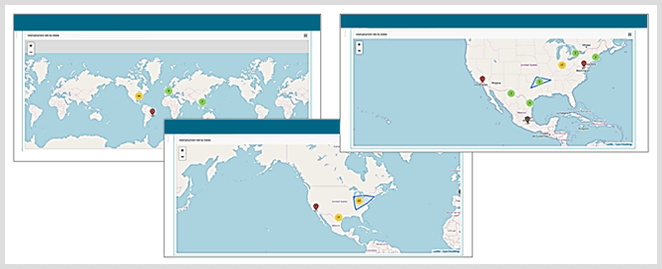
Marker Type
Marker type calls the geographical locations as points on the map. It expresses geographical position based on latitude and longitude coordinates as a Location icon.
The Marker type displays specific information (data) of a region in the tooltip. The following image shows Revenue information for the marked location.
Line Type
The Leaflet makes it easy to take spatial lines from one position to another on the map. These are to show information like the distance between two locations.
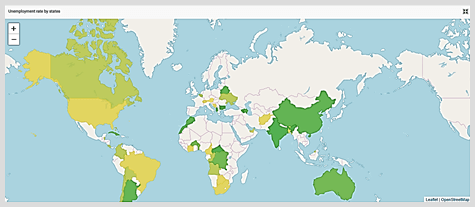
Polygon Type
This type is used to specify information related to a particular region on the map. Polygon shape shows the information relevant to a region in the tooltip; the user can set the desired color to that region.
Clustered Type
If a region or state or country contains many markers, then all the nearby markers can form a cluster. Click on a cluster to expand and display relevant information for all the markers belonging to that cluster.
Some Other Features:
- Points which are not in the static or dynamic range settings display in the default colors; the user can edit this default color from the chart properties.
- Custom tool-tip allows to display and edit extra fields in the data-tooltip.
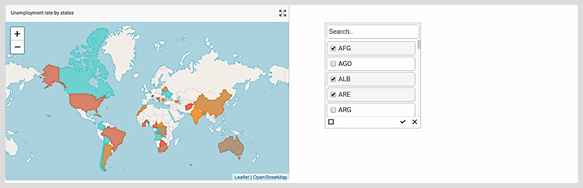
- All these map types support filtering of data from map to filters and vice-versa, so the user has control of the displayed information related to a particular region.
The leaflet chart is designed with simplicity, performance, and usability in mind. It works efficiently across all the major desktop and mobile platforms.