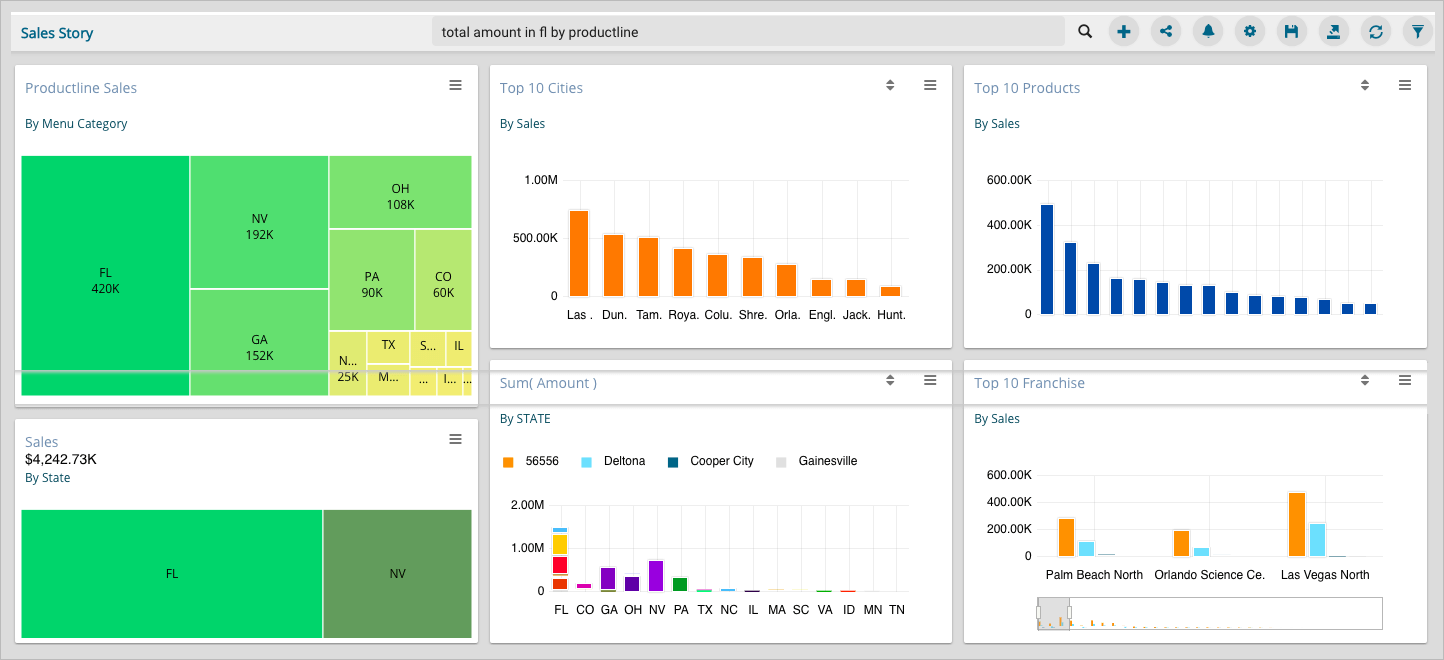
Almost every other BI Platform promises to provide Analytics and Visualization for your business data, but there are a few who indulges into a deep level of data exploration for your vast business data providing appealing visual insights for all your business decisions. BDB Decision Platform with its innovative data exploration techniques allows its users to penetrate their data and gain the hidden insights within a few seconds.
BDB's innovative Data Search Bar is an NLP based advanced data exploration technique that will amaze the users for its seamless performance while bringing user queried data within a few clicks.
BDB takes human and machine interaction from the touch of your fingertips to voice command through mobile apps. Just like Apple’s Siri and Amazon’s Alexa BDB’s AI enabled Data Search Bar brings a visual representation of your queried data within seconds. Users can instantly add the visuals to their data story for enriching their data insights and overall vision.
Users can effortlessly drill-down their oral or written query up to any level of data granularity. Such as they can type or speak queries like, “latest sales result,” “attendance of employees on a monthly basis” and get the result in no time. It helps to make great Self Service BI Dashboard in comparison to drag and drop.
BDB’s conversational analytics with its NLQ feature helps Business Users to extract concealed pearls of wisdom out of a large volume of data using the power of Elastic Search, Machine Learning, and core Algorithms. BDB can handle the enormous data and provide highly responsive data search experience to the users.
Let us see how precisely the interactive Data Search Bar works in the BDB Self-Service BI Dashboards:
- 1. Navigate to the ‘Data Search’ bar (inside a BDB Self-Service BI Dashboard).
- 2. Write your query based on the used dataset in the given data search bar to dive deep into your dataset (Users can even use voice commands to search data if they have access to the BDB Mobile Apps)
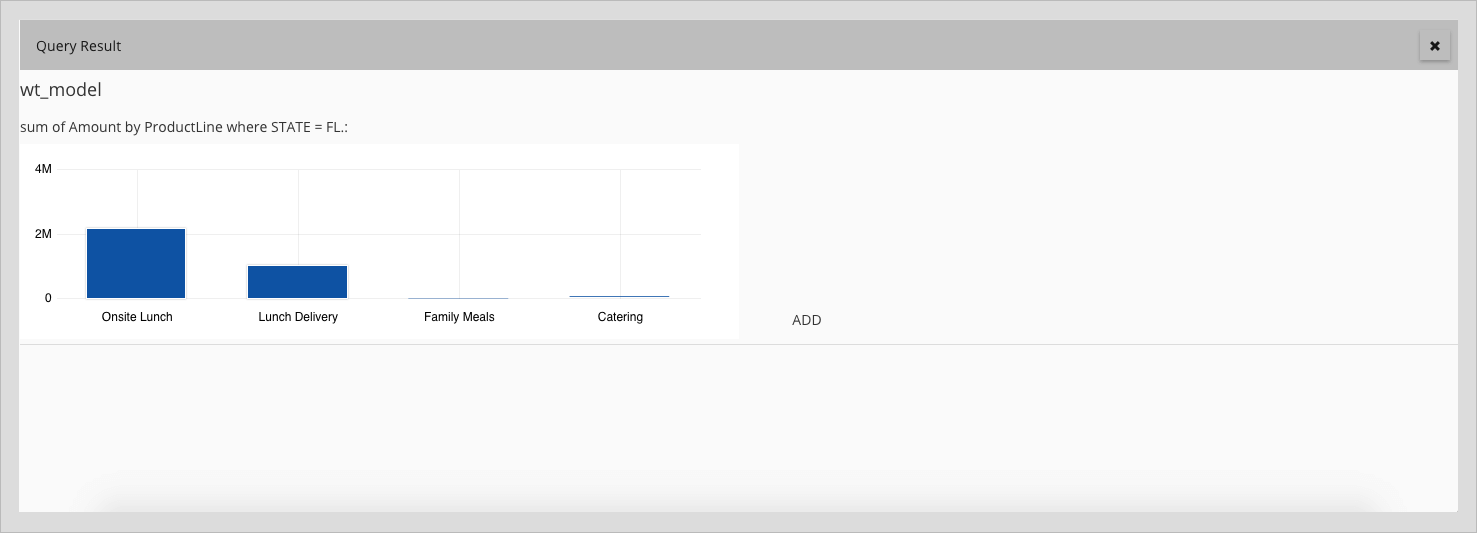
- 3. Get the result along with the appealing charts
In the latest version of BDB, we have come up with some new features to take our Conversational Analytics to the next level -
- More charts have been added as a Mixed Chart, String Value Answer, and Data Grids.
- Users will be getting description related to your query in the charts.
- The users will get notified in case they attempt query based on any unidentified fields
- Now, you can quickly search Top n/ Bottom n (n- any numeric value) of your question (by default it will be 5)
- After exploring your query through text or voice, the result that you get can be easily added to your Business Story.
The Best part of this feature is that you need not require any training, you can directly ask your question in the form of text or voice (Plain English), it will give you the result and later you can add it quickly to your Business Story.
BDB’s NLP based Data Search bar is a quick and easy way to get started building visuals for your business story without going through the entire dimensions and measures of your data. You can efficiently use Data Search to explore your data, even if you have a standard report NLQ can give you insights faster, and you can drill it furthermore and more.
Note: The search procedure is done on the dataset (in the form of a Data Store) used by the users, so there should be some saved views in the Self-Service BI Dashboard before you attempt your data query via the NLQ enabled data search bar.


