BizViz makes Excel better with Business Story and lets you play with your data
by Vineet Agarwal
Published: 2020
BizViz makes Excel better with Business Story and lets you play with your data
Create your Business Story in 10 mins!
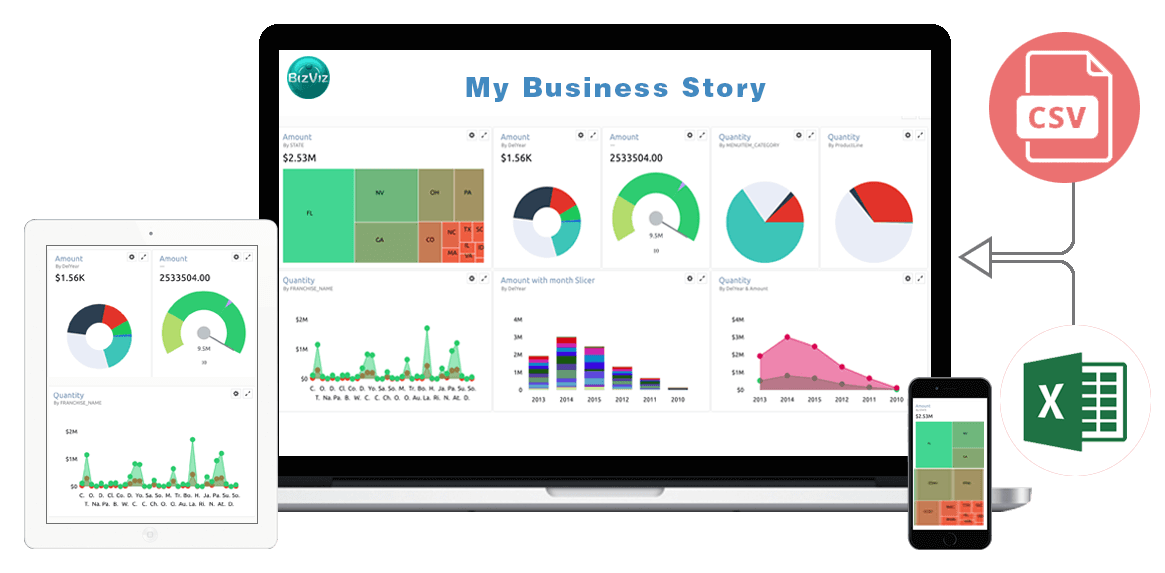
You can now visualise other's designs in your own way plus add your data visualisation to it. Push your excel data in BizViz Cube to create your own Story. Now you can play with the data and represent it in the way you want !!
Create a business story and translate that story into results. Engage your Executive Team and explain your strategies and results more powerfully by approaching your project as a story. You don't have to be a genius or hiring a techie to create reports but with BizViz Platform it becomes a piece of cake!
You will need the "What?" of your story (the facts and data) but you also need the "Who? How? And Why?" and the often missed "So what?" These are the story elements that will make your data relevant and tangible to your audience.
Why BizViz Users are loving Business Story?
Make sense and order out of disparate facts
Shows the Bigger Picture
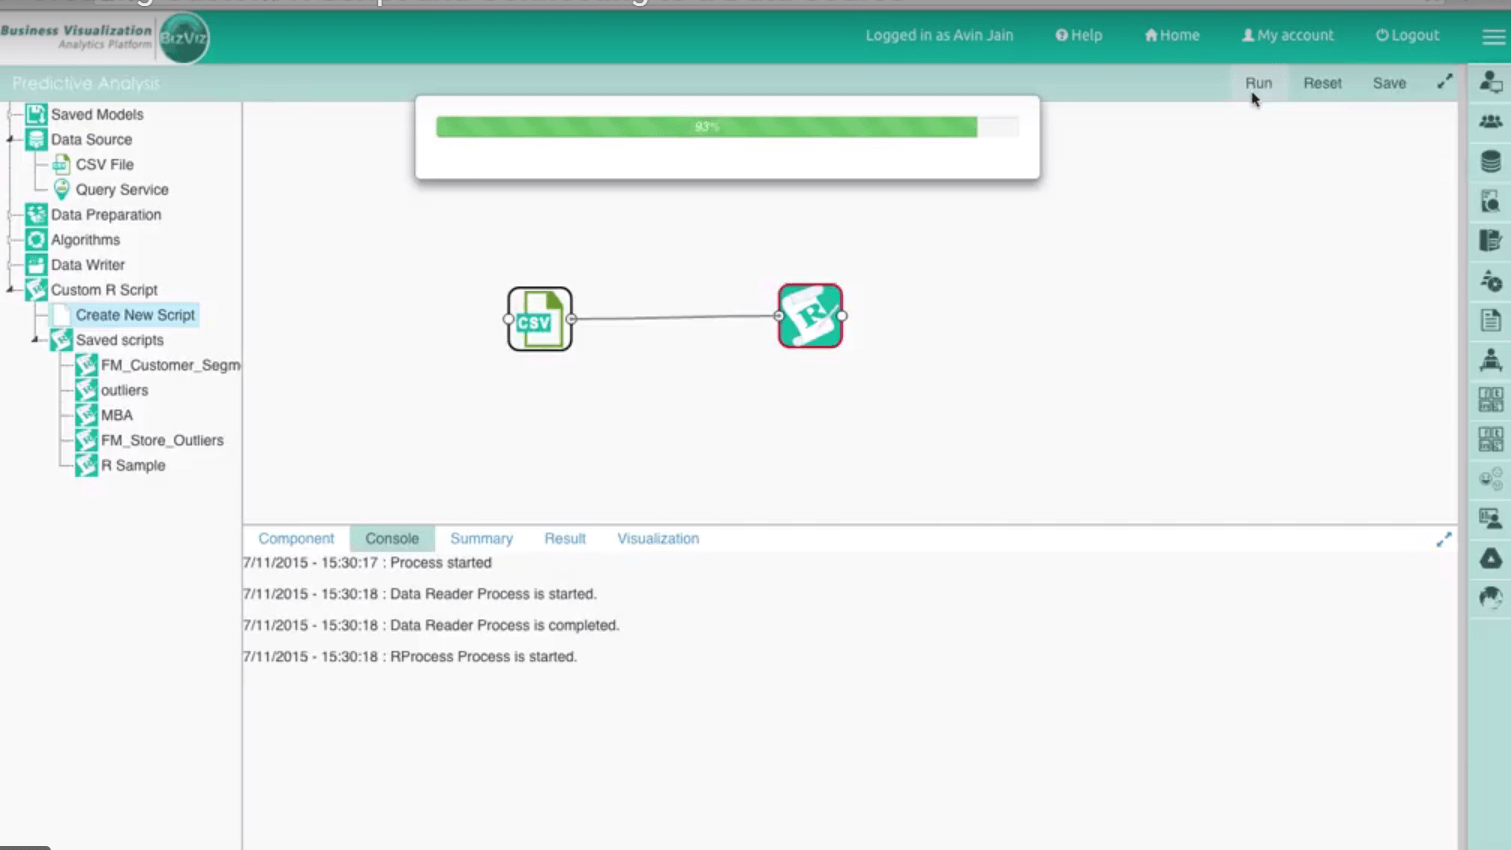
See your Predictive Analysis in different charts
Envision what the future could look like
Interactive-People put themselves into stories
Make your job easier
Complete responsive design (easily arrange KPIs to suit your needs)
Self-service Business Intelligence(even middle school kids can play with it)
Watch this Video to see Business Story Created on Obama Health Care Data in Minutes!!
Why BizViz Business Story ?
Why Excel? Because Excel gives you the data you need.
Why Business Story? Because Business Story gives you the Data Visualisation you need. It has many calculations built inside which helps you to see your data in Dials, Grids, Charts (all types), Bubble, HeatMap, Pie, Donut, Stack Bar, Mixed Charts using different formulas, aggregations, Sorting etc.