BizViz 2.5 is now Generally Available! BizViz - Powerful Yet Simple.
Background
BizViz is excited to announce the general availability of version 2.5 of our industry-leading data analytics platform. As we launch the latest version of BizViz, I wanted to give you a high-level overview of the BizViz platform and very briefly cover some of the new features we’ve been working. We’ve been listening to our customers’ feedback and brought their great ideas to this version. We’ve also implemented some cutting-edge features to ensure that BizViz remains the leader in the analytics space. The days of waiting weeks for your reports are finally over.
BizViz Platform
To put it simply, the BizViz Platform is a portal that hosts various BizViz components (‘Plugins’) such as ‘Plugin Manager’, ‘Administrator’, ‘User Management’, and ‘Dashboard Designer’. The BizViz portal can be either deployed on premise or hosted in the cloud. The Plugin Manager integrates the various products and services available with the BizViz platform and can also be used to integrate customized, client specific plugins. It can even be integrated with Microsoft SharePoint. Users can access information published on the BizViz platform through a web browser, even on their mobile phones. BizViz Administrator provides secure authentication, ensuring that only those who have appropriate permissions can access information.
What's New in v2.5:
- With our new Web Single Sign-On with SAML, BizViz can authenticate with a client’s SAML identification provider.
- A Dedicated Connection Engine has been implemented. This brings modularity to the data services which provides more control over the service layer.
- We’ve introduced a basic authentication mechanism for OData services so that secured services can be consumed by the BizViz portal.
- Linux administrators can use or new Installation Package to greatly simplify and speed up the installation process. This will help IT administrators to easily manage BizViz installations without needing to learn anything new.
-
Data Store Monitoring has been introduced to help monitor the health (RAM utilization, Hard drive space, CPU spikes, Network) of the data store module.
Dashboard Designer
BizViz Dashboard Designer is a browser based application used to build dashboards and design analytics. Designing dashboards is a breeze with BizViz’s drag and drop functionality, allowing users to quickly and easily create dashboards. Dashboard Designer comes with a wide variety of built-in charts and data integration capabilities that empower users to create information-rich and interesting visual representations of their data. It can even integrate with your existing data. Users can also dig deep into their data at any level using the powerful zoom feature. Dashboard Designer also offers other powerful features such as dynamic-visibility, and flexible export options.
What’s New in v2.5:
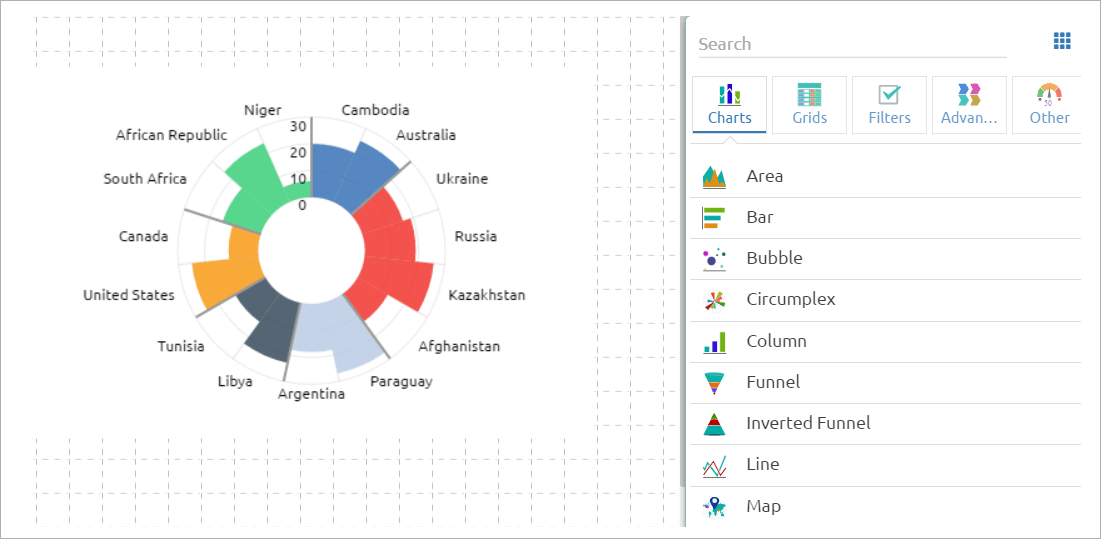
- We’ve added a new ‘Circumplex’ chart, otherwise known as a Polar Area chart, which is a hybrid of a pie chart and a bar chart.
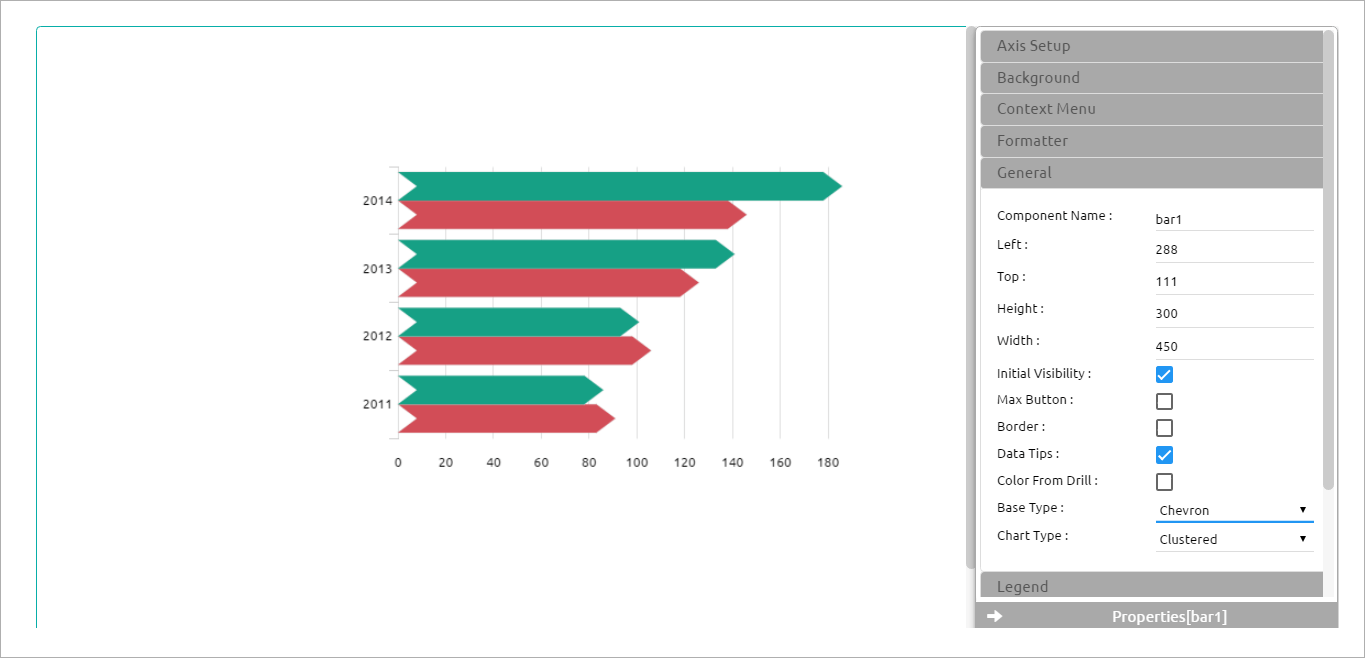
- A new Chevron shape is now available in the Bar and Group Bar Charts which an be used to show progress of projects even when your data is not in date format.
- Repeater properties for the Line and Bar charts has been introduced which can be used to break out a chart that has combined categories into separate charts.
- Clustered View is new to the Group Bar Chart This can be used to break out a group bar chart into individual ‘clusters’, so that the data is more easy to understand and more detail is available to the end-user.
Business Story
Stories bring life to data and facts. So why not approach your business data as a story? Bring together Who, What, Why, and How to answer the all-important ‘So What?’. Business Story allows you to convey and explain your strategies and results by approaching your data as a story. This allows you to engage your audience and make the facts interesting, understandable, and easy to remember. Business Story helps make sense of a hodgepodge of facts, helping you your team focus on what is important. Best of all, your business stories will provide interactivity, helping answer the relevant questions with ease. Business Story is self-service BI that offers a very simple, intuitive way to drag-and-drop relevant data to quickly build your story. Business Story will do the rest, building an easy to use, interactive chart, making your job easier.
What’s New in v2.5:
-
We’ve introduced Elastic Search, improving data querying performance by 10x.
- Adjustable chart grid has been added to the Storyboard so you can customize the view size
- Scrollable charts are now available, so that charts can now be scrolled, so that more data to be displayed without taking up more area.
Survey
Using Survey, your organization can create unique, interactive surveys, thus allowing you to gather valuable feedback from clients, potential customers, employees, etc… Using BizViz Dashboarding tool, beautiful and engaging charts can then be built upon the survey data, providing an easy to digest view of the data that can lead to helpful insights. There are nearly 30 different question types to choose from. You can even control your survey by setting start and end dates and times. Your organization can then analyze the feedback, even text, using BizViz’s powerful Sentiment Analytics tool.
What’s New in v2.5:
-
Users can now create Survey Templates that can be reused, greatly reducing time and effort.
-
‘Filter Rules’ has been introduced so that administrators can now view only specific responses and not have to wade through all of the results.
-
Scheduler functionality has been brought to the DataMart. This allows the administrator to schedule the DataMart to automatically update, simplifying the administrator’s work.
Social Media Browser
Social Media Browser is used to extract data from social media sites such as Facebook and Twitter. This extracted data will be brought into the BizViz platform, thus enabling the data to be consumed for sentiment analytics. The results can then be pushed to BizViz’s dashboarding framework for analysis and presentation.
What’s New in v2.5:
-
Using Machine Learning, BizViz is smart enough to eliminate advertisements in Facebook posts and comments.
Predictive Analysis
BizViz Predictive Analysis empowers its users by providing predictive models to look into the future of their organizations and business processes. It is a user-friendly tool that shields users from mathematical complexity and offers interactive graphical user interfaces to give users an easy, intuitive experience. It enables the users to discover hidden insights and relationships in their data by allowing them to drill-down into it. BizViz Predictive Analysis uses powerful analytical and predictive models to accurately predict the future of business processes. It empowers users so that they can look into the future, to not only see where they are headed, but also see what the results of any changes would be in the future. The Predictive tool connects to a wide range of data sources. After the data has been processed using the predictive models, it can be visualized using beautiful graphs and charts.
What’s New in v2.5:
-
We’ve introduced Spark Machine Learning. (Naïve Bayes with Validation). This is applicable in areas such as fraud detection, employee churn, credit scoring.
-
We now have Multiple Workflows to simplify the modelling process.
- With our new Model Performance evaluation, users can compare and evaluate the performance of the models to determine the most suitable model.
The best part is that all of BizViz’s plugins are integrated together to give you a holistic, one-stop shop to gather, view, slice and dice, analyze, and present your data. BizViz can even be integrated with your 3rd party applications and portals. BizViz offers rapid time to value. We would love to show you how BizViz can help your organization make better decisions. Please contact us for a demo.


