Kubernetes Implementation for BDB Platform
BDB 4.0 can be deployed in bareMetal as well as in Kubernetes Custer which manages containerised applications along with some enrich functionalities of its own that gives us the flexibility to manage the Deployments and scaling the application. The above diagram shows the most common end to end deployment of BDB 4.0 with components like Data Stores (Elastic servers), AI Workbench (R, Python, Deep Learning (with GPU machines for Video Analytics), Data Pipeline with Kafka, Spark environment and Data Preparation, Data Quality in Spark and Hadoop environment. The boundary shows all the components installed in Kubernetes cluster. Other components are installed outside Kubernetes. The platform is microservices based and therefore it can have many combinations of Install (like (Platform + Dashboards) or (Platform + Dashboards+ Elastic) or (Platform + Dashboards + R or Python based Predictive Workbench)). We can have 8-10 different permutations and combinations possible for different type of Customer Deployments. BDB 4.0 is an end to end platform that can help you build your next generation Analytics Services.
What is Kubernetes?
What is Kubernetes?
Kubernetes is a portable, extensible open-source platform to manage containerized workloads and services, that facilitates both declarative configuration and automation. It owns a vast, swiftly increasing ecosystem. Kubernetes services, support, and tools are widely available. K8s is an open-source self-healing platform to deploy, scale and operate containers. Originally designed by Google.
With Kubernetes, developers can quickly develop highly available applications by leveraging the power and flexibility of containers, and with integrated and secure volume service, we can store persistent data, share data between K8S pods, and data can be restored when needed.
Leveraging Kubernetes
Leveraging Kubernetes
In the early stage of implementation of K8S cluster, the primary challenge was to containerize the platform. Tools such as Docker provide the actual containers. We researched and adopted this, and our microservice based architecture helped us, and we moved our platform services in n number of Docker containers which are loosely coupled with other containers for seamless communication.
Now the challenge was Container clustering, integration and implementing Continuous Integration and Continuous Deployment.
For container orchestration, we have n number of tools available in the market like Mesosphere, Kubernetes, Docker Swarm, etc. We chose to go with Kubernetes as it is providing more flexibility and support from open source community.
Deployment Architecture

Step 1 - GitLab
We stored all our source code, artifacts in GitLab, which includes the dockerfiles that are needed for creating the image, YAML files are necessary to create a pod and the configuration files. In the next step, we build our source code using Jenkins. Jenkins is on another server (We call it as build server) where docker services are also running.
Step 2 - Jenkins + Docker
BDB uses Jenkins for continuous integration and builds automation to create/pull/retag the docker image. Jenkins job will create war files and binaries. Jenkins will pull dockerfiles also of the containers from GitLab; we have a shell script on place in the build server to create docker images of our microservices.
Step 3 - Docker Image Registry
All the images created by the above steps will be pushed to private docker image registry.
Step 4 - K8S cluster
Our K8S cluster consists of one or more physical or virtual machines, also known as worker nodes, that are loosely coupled with each other, extensible, and centrally monitored and managed by the Kubernetes master. When we deploy a containerized app, the Kubernetes master decides where to deploy the app, taking into consideration the deployment requirements and available capacity in the cluster.
A user can request to Kubernetes to deploy the containers using kubectl, specifying the number of replicas required for high availability. The scheduler decides where the pods (groups of one or more containers) will be scheduled and which worker nodes the pods will be deployed on, storing this information internally in Kubernetes and etcd. The deployment of pods in worker nodes is updated based on load at runtime, optimizing the placement of pods in the cluster.
Now as our docker images are ready and in place in private Docker repository, we need to deploy the application in Kubernetes. For this, we use kubectl command. The kubectl is command line interface for running commands against kubernetes clusters. You can configure the kubectl for Kubernetes clusters by exporting the cluster’s config file. We use kubectl commands to update deployments in the K8S cluster. The kubectl commands will interact directly with the master node of the cluster and master will schedule the pods in worker nodes according to the availability of resources in nodes.
The kubelet running in each worker node frequently polls the Kubernetes API server in case, if there is a new task to do, kubelet pulls the configuration information and acts, for example, spinning off a new pod.
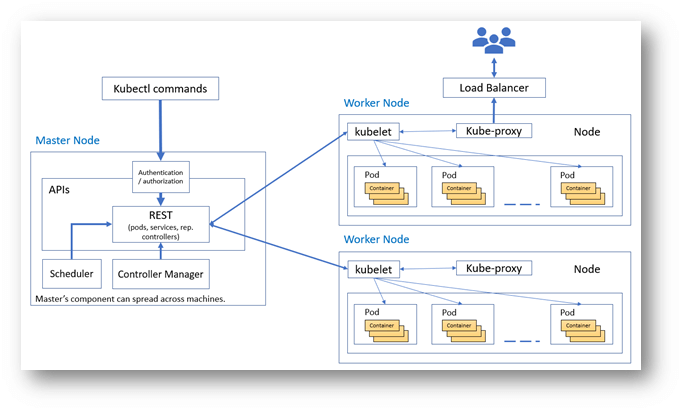
Kubernetes – Cluster Architecture
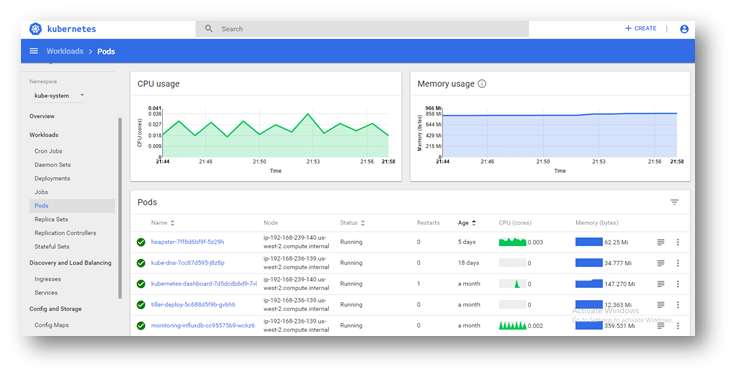
Kubernetes Dashboard
We use K8S Dashboard extensively for the purpose of monitoring, executing the pods, deploying the applications, creating stateful sets, creating namespaces, etc.
The dashboard is a web-based Kubernetes user interface. Users can use Dashboard to
install containerized applications to a Kubernetes cluster, troubleshoot your containerized
application, and manage the cluster itself along with its attendant resources. Users can use
Dashboard to get an overview of applications running on your cluster, as well as for creating
or modifying individual Kubernetes resources (such as Deployments, Jobs, Daemon Sets).
E.g., you can scale a Deployment, initiate a rolling update, restart a pod or deploy
new applications using a deploy wizard.
The dashboard also provides information on the state of Kubernetes resources in your cluster, and on any errors that may have occurred.
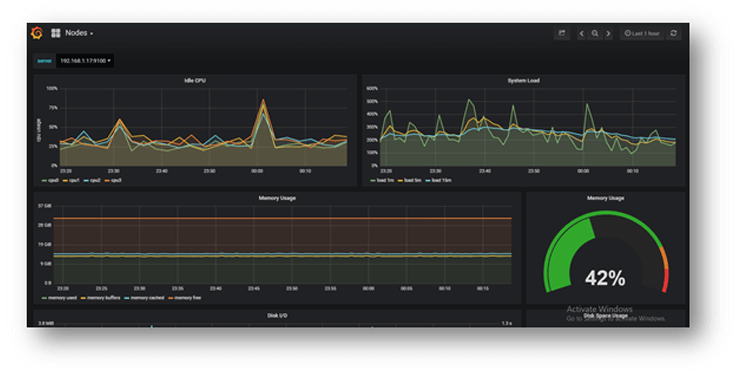
Monitoring
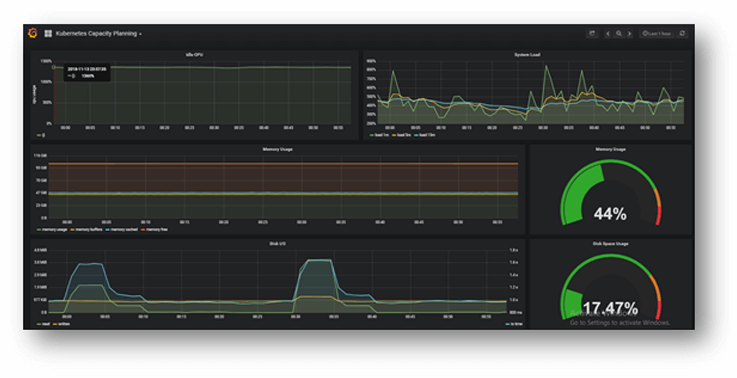
We use Prometheus toolkit to monitor and alert the K8S cluster. We have integrated Grafana on top of the Prometheus metrix to have a meaningful dashboard. This dashboard provides us:
- Proactive Monitoring
- Cluster Visibility & Capacity Planning
- Metrics Dashboard
- Alerts & Notification
Exposing Services
Kubernetes Pods are mortal; they have a lifespan. When a worker node dies, the running Pods on
the Node also gets lost. Then a Replication Controller dynamically drives the cluster back to the desired state via the creation
of new Pods to keep your application running. E.g., consider an image-processing backend with 3 replicas. Those replicas
are fungible; the front-end system must not care about backend replicas or even if a Pod is lost, and recreated. Each Pod
in a Kubernetes cluster has an unique IP address, even Pods on the same Node, so there needs to be a method of
automatically reconciling changes among Pods so that your applications continue to function.
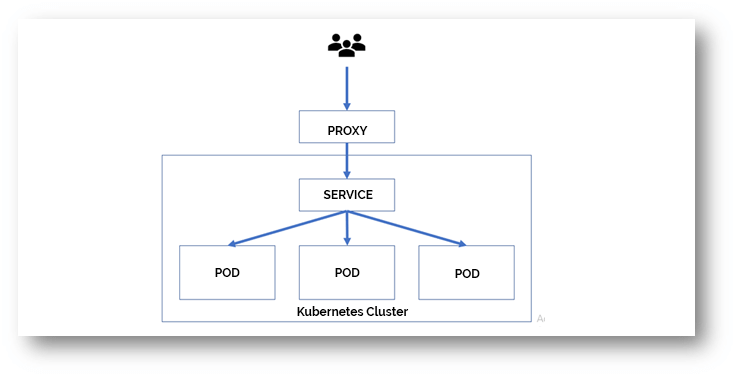
Even though each Pod has a unique IP address, those IPs are not exposed outside the cluster without a Service. Services allow your applications to receive traffic.
We use Nginx to expose the services outside of the K8S cluster. A brief illustration is explained in below image.
Scaling
There are two kinds of scaling possible in K8S clusters
Kubernetes scales cluster with the help of Cluster autoscaler, i.e., dynamic nodes. It observes the pods continuously, and if it finds that a pod cannot be scheduled, then based on the Pod Condition, it chooses to scale up. It is more effective than looking at the CPU percentage of nodes in aggregate. Since a node creation can take approximately a minute or more dependent on your cloud provider and other factors, it may also take time till the pod can be scheduled.
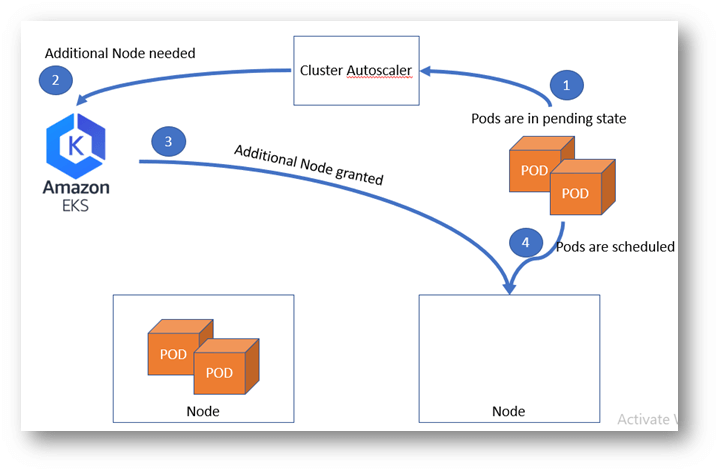
For production environment we are using Managed Kubernetes provided Amazon EKS (Amazon Elastic Container Service for Kubernetes). EKS is highly available, scalable and secure Kubernetes service.
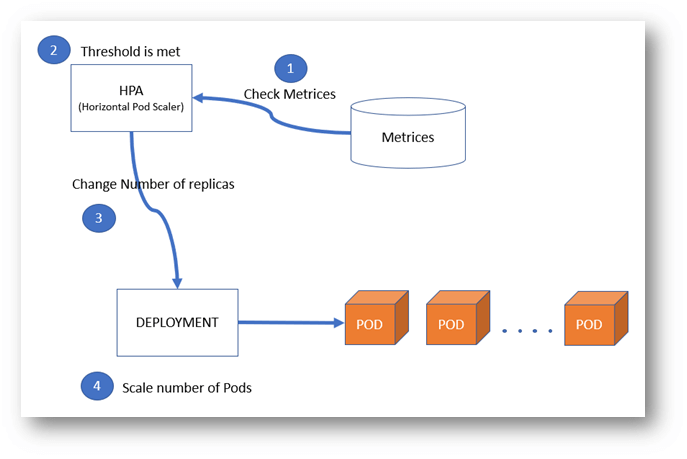
Horizontal pod autoscaler is a control loop that observes and scales a pod in the deployment. It can be done by creating an HPA object that refers to a deployment/replication controller. You can define the threshold and minimum and maximum scale to which the deployment should scale.