Customer Analytics
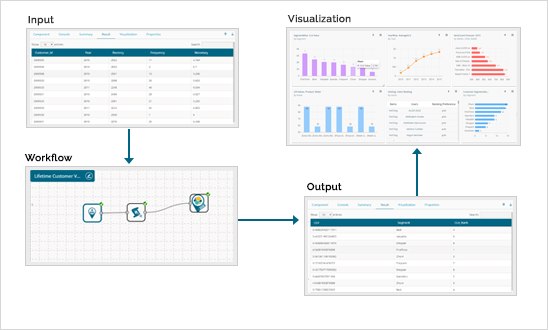
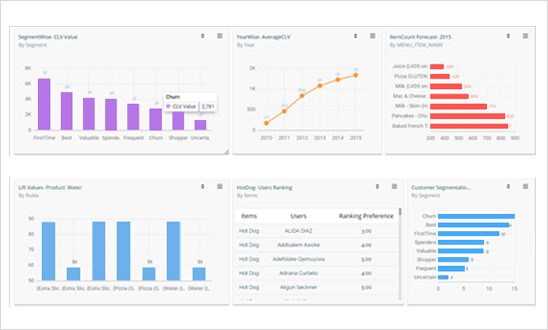
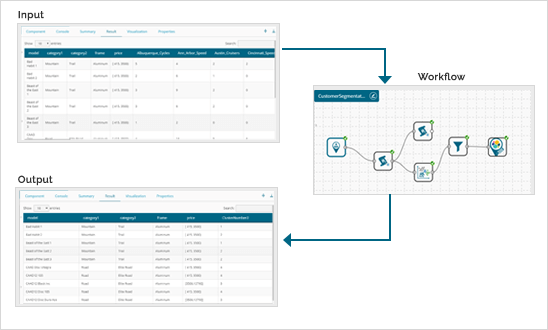
Attain Accurate Customer Analytics


Its primary purpose is to indicate the level and direction of future business activity so that all teams and functions in a company have time to respond to changes.
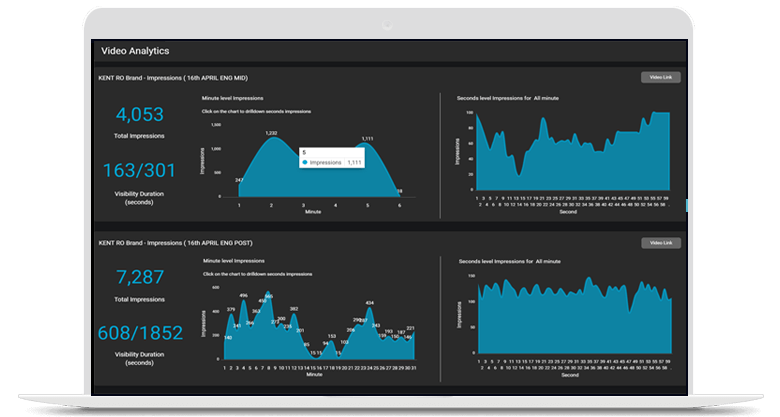
Social Media Analytics
Social media analytics is the practice of gathering data from social media websites and analyzing that data to make business decisions. The most common use of social media analytics is to mine customer sentiment to support marketing and customer service activities.
Social media is a good medium to understand real-time consumer choices, intentions and sentiments. The most prevalent application of social media analytics is to get to know the customer base to help better target customer service and marketing.
There is a tremendous amount of information on social media today. In decades past, enterprises paid market research companies to poll consumers and conduct focus groups to get the kind of information that consumers now willingly post to public social media platforms.
Sense of Purpose
Models Used
-
Campaign Analytics
-
Sentiment Analytics
>In todays era, tracking your money spent along with the returns that the business gets out of the campaigns run on social media has become a need for every organization.
With our Campaign Analytics Solution, compare campaigns carried out on different platforms which will cater to the problem – Where & How much to invest?
Sense of Purpose
We believe it is important to classify incoming customer conversation about a brand based on 2 factors, Key aspects of a brand that customer care about., Users underlying intentions and reactions concerning those aspects. These concepts when used in combination, becomes a very important tool for analyzing millions of brand identity with human level accuracy.
The workflow takes tweets data as input and classifies these tweets as positive, negative and neutral based on LSTM based NN
Sense of Purpose